Region and Focus Area
The AMA encompasses the city of Amsterdam, the provinces North Holland and Flevoland with 36 municipalities, and a total population of over 2.4 million inhabitants. AMA Central Administration (BKG) has the administrative responsibility for the area.
The focus area, which is part of the functional unit for the environmental assessment within repair is located in the peri-urban areas in the west and south west of the AMA
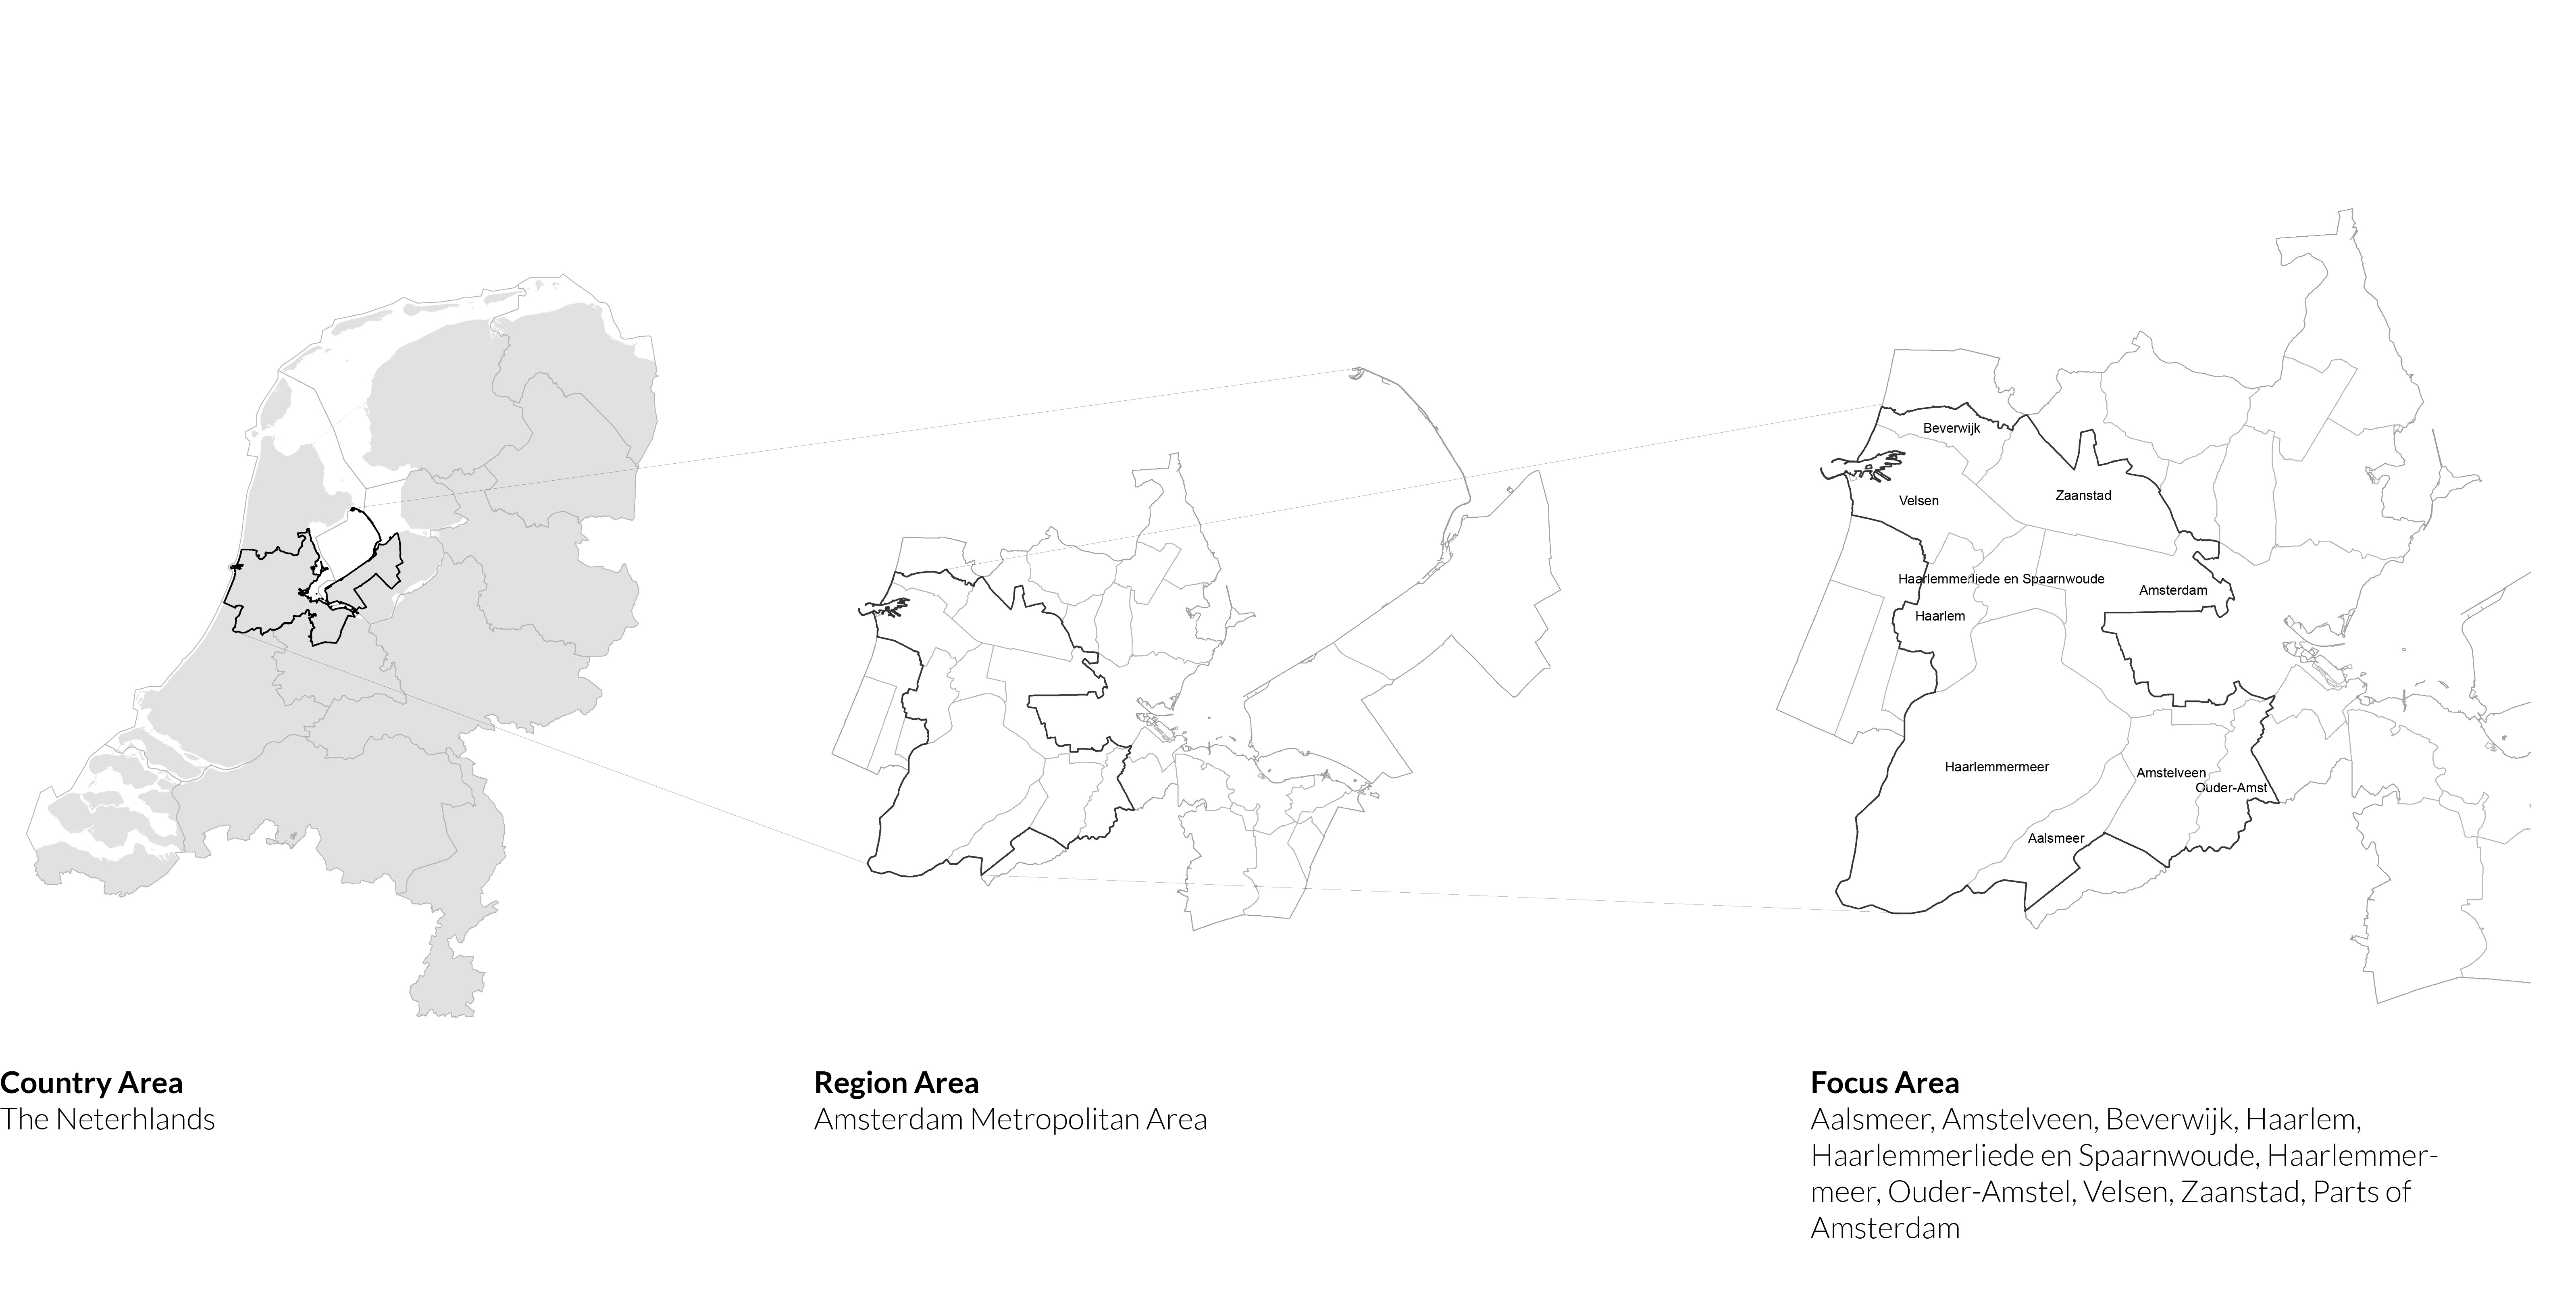
Figure: The location of the region and focus area of the Amsterdam case.
Key priorities
During Interviews and the PULL workshops the stakeholdes in the amam defined the following key priorities.
- Regional leadership: to coordinate across levels and sectors there is a need for regional leadership to set priorities, regulate, set rules and steer development of circular economy to show a clear roadmap, develop pilots, set rules on local reuse/exploitation of waste VS. centralised incineration or recycling by the big players.
- Intra-institutional coordination: big organisations have their own internal clashes of priorities and differentiated levels of awareness and interest in circular economy, thus internal leadership and coordination to mainstream circularity is needed. While there are many visionary leaders both in the public sector organisations (municipalities) and business (e.g. Schiphol), there is organisational inertia, which creates a barrier in pushing forward their ideas and visions due to reluctance of the lower, more operational echelons in the organisations
- Overcoming inter-institutional barriers: need to stimulate cross-institutional dialogue to foster shared understanding of circularity.
Mitigating market failures
- Ownership of waste: To avoid conflicts and market failures due to competition for waste as a resource the question of ownership of waste need to be clarified, otherwise the big players, are likely to dominate and compete for getting more waste. This in turn could prevent innovations to utilise waste locally and on a bottom-up basis, but also creates disincentives to reduce waste production. This probably requires legislative action, but also non binding rules like open book-keeping to monitor the waste flows and thus maximise efficiency, however, companies are reluctant towards it.
- Financing gap: need regulations that will make investment in circular projects less risky and thus make it easier for innovators to get access to credit (WP6_6.1_1A). EU subsidies (European Regional Development Fund) are used by some actors to bridge the funding gap to an extent, e.g. Greenport Aalsmeer (WP6_6.1_3A).
- Regulating competition for waste: business players want to keep innovations to themselves, they want to extract the most value from waste for themselves, thus there is a need for incentives and/or regulations to encourage more cooperation and openness.
Removing regulatory barriers to innovation
- Building regulations: building regulations should make it possible to overcome the noise problem and build housing in vicinity of the airport.
- Waste transport regulations: transporting and processing waste is subject to strict regulations, which prevents innovating and experimenting, these barriers should be removed if waste is not hazardous.
- Tendering rules: thresholds for tender requirement are too high, making it difficult to run pilot projects.
Getting the business interested in circular economy
- Procurement rules: need to provide incentives for companies to engage in circular economy to stimulate them to take action (need new tender rules); municipalities play a key role here because they tender a lot;
- Building regulations: scope for innovating with rules for new construction to push towards circularity .
- Leadership: need some big businesses to lead the way and show that circular business models work.
- Knowledge: many ideas on circularity are out there; however, what is missing is a shared understanding of what it in practice means and how to actually implement it in a way that is profitable rather than burdensome for businesses; need for eco-innovative solutions tailored to the needs of the sector and ideally connecting to other actors in the region; need for knowledge on how to procure in a circular way, what to ask the market for, specifically; a need of transparency and incentives for knowledge sharing between businesses.
Key flows – foodwaste
During the interviews conducted with stakeholders in the region (WP6) and the PULL workshops in the co-exploration phase (WP5), the importance of both construction and demolition waste (CDW) and organic waste(OW) value chains have been confirmed and further specified. With regard to the OW flow, the subcategory Food Waste (FW) was pin-pointed as a primary concern. Therefore, with regard to the process model for the Amsterdam case, the focus has been restricted to the FW case.
The choice of food waste as a material scope for the AMA region is among other supported by the following:
- Roughly 30% of anthropogenic GHG emissions are caused by the food system (Garnett, 2016).
- In the 2009 ‘nota duurzaam voedsel’, the Dutch ministries of Economic Affairs, Infrastructure and the environment have set the goal of decreasing the food waste produced in the Netherlands by 20% in 2015 compared to 2009. It was found however, that the FW generation only decreased by 1% and no new goal was set by the government as they acknowledged that the tools to analyse FW reduction strategies and the means to measure their impacts are absent (interview with previous State Secretary of Economic Affairs Van Dam in TV show De Monitor in 2017).
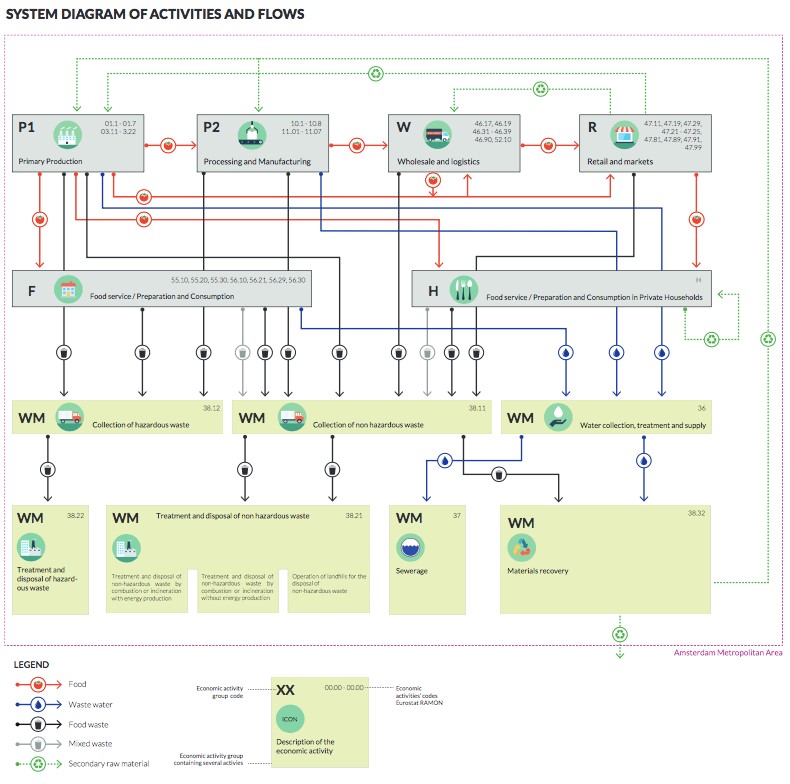
Figure: The system diagram of activities and flows that build the system of the food value chain in the Amsterdam metropolitan area.
“The role of Work Package 3 within the REPAiR project is to develop and implement territorial metabolism models. The aim is to analyse, describe and model the AMA case study area with its subsystems and processes, while defining the area’s current metabolic patterns. Vantage point is waste production and waste management, and more specifically the shift from linear to circular resource systems. Based on local policy priorities, the flows in focus for the AMA case study are: Food Waste and Construction & Demolition Waste.”
Example images:
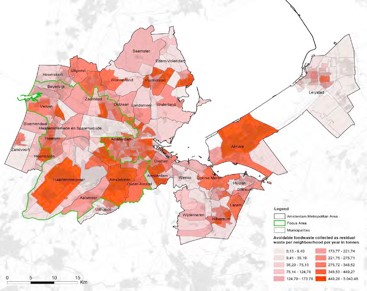
Avoidable food waste collected as residual waste per neighbourhood per year in tonnes in the AMA in quantiles.
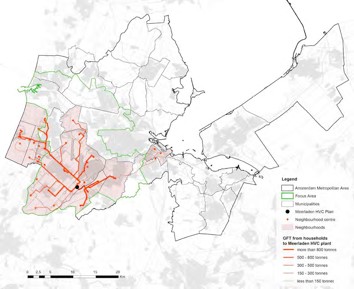 The material flows collected as GFT waste in the wasteshed of De Meerlanden composting facility in kg per year, per neighbourhood and its locations in the AMA.

Figure: Companies of the activity group P2 (processing and manufacturing), representing 80,500 out of 87,500 of total tonnes of food waste produced in the AMA
Wastescapes
The wastecape map visualise different types of neglected, wasted and underused spaces, namely: contaminated land, transport safety and noise areas, contaminated waterbodies, infrastructures, abandoned buildings, land and industries, unused greenfield next to infrastructure and the operational infrastructure of waste.
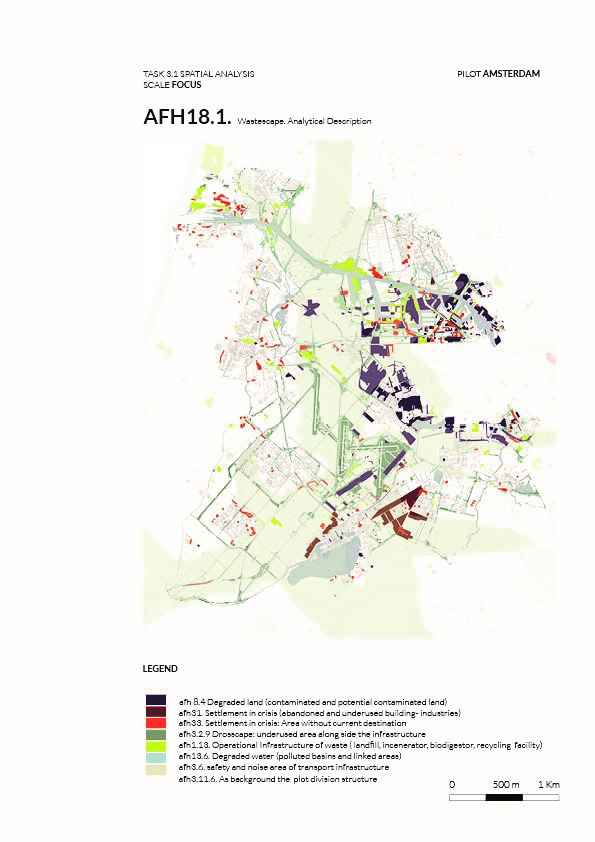
Figure: Wastecape distribution in the AMA
For more detail see the project report section of this webpage.